Inventory
Reorder levels, safety stock and min-max stock: a working method for Indian traders
How to decide, item by item, when to order and how much to hold, using numbers you already have in your sales and purchase registers.
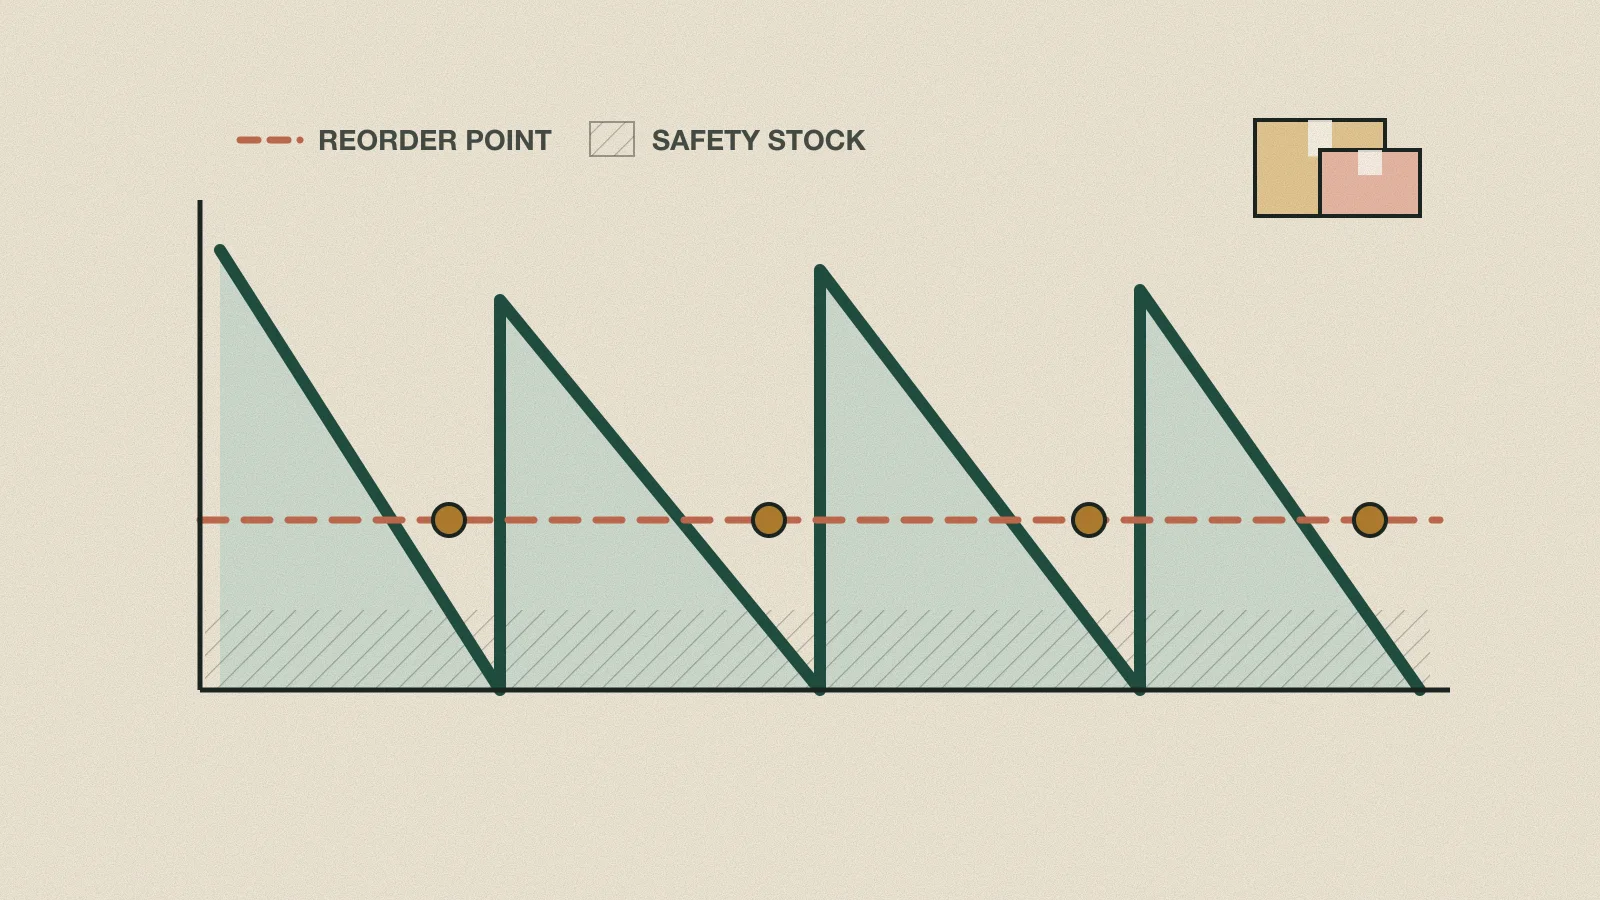
Walk into most distributor godowns in India and you will find the same two problems sitting side by side. The fast item that the salesman promised a retailer is out of stock, and three racks away there are cartons of a slow item that nobody has touched since the last Diwali. Both problems cost money. The first loses a sale and sometimes the customer. The second locks up cash that is often borrowed on the cash credit limit at interest.
The usual fix is the owner's memory: he looks at the shelf, remembers roughly how fast it moves and phones the supplier. That works for fifty items. It does not work for 1,500 items, two godowns and a son who has just joined the business. What follows is a plain method to put a number on every item: when to reorder, how much buffer to hold, and the upper limit beyond which you are simply parking cash.
What is the reorder level formula?
The reorder level is the stock quantity at which you place the next order. The formula is: reorder level = average daily sales × lead time in days + safety stock. Lead time is the number of days between placing the order and the goods being on your shelf, ready to sell. Safety stock covers days when sales run faster or the supplier runs late.
Three inputs need care. Average daily sales should come from your sales register for that item, not from a guess. Take the last 60 or 90 days, add up the quantity sold and divide by the number of working days, not calendar days, if you close on Sundays. Leave out one-off bulk orders, such as a single institutional order of 500 units, or they will inflate the average for months.
Lead time should be measured, not quoted. The company representative may say "three days", but your purchase register tells the truth: compare the date of each purchase order with the date the bill was entered. Many traders find their real lead time is nearly double the quoted one once transport and Sunday closures are counted.
Safety stock is the part most people either skip or overdo, so it gets its own section.
How do you calculate safety stock for a shop or distributor?
A practical safety stock formula is: (maximum daily sales × maximum lead time) − (average daily sales × average lead time). It holds enough extra stock to survive a bad week where sales peak and the supplier is late together. A simpler alternative is a fixed number of days of cover, such as three or five days of average sales.
The max-minus-average method needs two more numbers from your records: the highest daily sale of the item in the period and the longest delivery delay you actually had. If the worst lead time was caused by a once-in-five-years transport strike, use the next worst one instead. Safety stock is insurance, and insuring against every possible disaster is too expensive.
The days-of-cover method is easier to explain to staff and works well for C items. For a medical store, you might hold five days of cover on chronic medicines that patients buy every month, because a regular patient who finds the shelf empty tends to start buying elsewhere, and two days on items that customers will happily wait for.
Statistical methods based on standard deviation and service levels exist and are taught in operations courses. They give better answers for large catalogues, but they need clean data and software. For most traders the two methods above, applied honestly, get you most of the benefit.
A worked example: reorder, minimum and maximum levels for one item
Here is an illustration for an FMCG distributor. The item is a 1-litre sunflower oil pouch costing ₹135 to buy. The figures are invented for the example, but the arithmetic is exactly what you would do with your own registers.
| Input (from the last 90 days) | Value |
|---|---|
| Average daily sales | 48 pouches |
| Maximum daily sales | 60 pouches |
| Minimum daily sales | 35 pouches |
| Average lead time | 6 days |
| Maximum lead time | 8 days |
| Minimum lead time | 5 days |
| Usual order quantity (about 15 days of sales) | 720 pouches |
Now the calculations, step by step:
- Lead-time demand = 48 × 6 = 288 pouches. This is what you expect to sell while waiting for the order.
- Safety stock = (60 × 8) − (48 × 6) = 480 − 288 = 192 pouches.
- Reorder level = 288 + 192 = 480 pouches, worth about ₹64,800 at cost. When stock touches 480, the order goes out.
- Minimum level = reorder level − (average daily sales × average lead time) = 480 − 288 = 192 pouches. If stock falls below this, the order is late or sales have jumped, and somebody should phone the supplier the same day.
- Maximum level = reorder level + order quantity − (minimum daily sales × minimum lead time) = 480 + 720 − (35 × 5) = 1,025 pouches, worth about ₹1,38,375. Stock above this is cash parked on the rack.
These are the minimum, reorder and maximum formulas found in Indian cost accounting textbooks, and they translate well to a godown. If your salesman wants to book 1,500 pouches on a scheme, the maximum level tells you that roughly 475 of them are excess. That excess is worth about ₹64,000, and you can weigh it against the scheme discount before agreeing.
Write the three numbers (minimum, reorder, maximum) against the item in your software or on a sheet. Any decent billing system will then list items below reorder level every morning instead of you walking the racks.
Which items need tight reorder control? Using ABC analysis
ABC analysis sorts items by the money they tie up or the sales value they produce in a year. A small group of A items, often around a tenth to a fifth of the catalogue, usually accounts for most of the value. These get carefully calculated reorder levels and frequent review, while the long tail of C items gets simple rules.
To do it, export a year's item-wise sales value (quantity × purchase rate works better than selling price), sort it from highest to lowest and add a running percentage. There are no fixed cut-offs. A common split is shown below, but adjust it to your own list.
| Class | Typical share of items | Typical share of value | How to manage |
|---|---|---|---|
| A | 10–20% | about 65–75% | Calculated safety stock, reorder level reviewed monthly, counted monthly |
| B | 20–30% | about 20–25% | Reorder level reviewed quarterly, counted quarterly |
| C | 50–70% | about 5–10% | Days-of-cover rule, larger orders less often, counted twice a year |
Two refinements matter in India. First, run a separate check for items that are cheap but critical. A medical store's insulin or an emergency drug may be a C item by value but must never run out. Second, do the analysis by godown if you have more than one, because what is an A item in a city shop may be a C item in a rural branch.
How should you treat slow-moving, dead and seasonal stock?
Divide items by how recently they sold: fast movers sell every week, slow movers sell occasionally, and dead stock has had no sale for a fixed period such as 180 days. Seasonal items need their reorder level built from last year's sales in the same months, not the current average, and they need a planned stop date.
The tool for this is the stock ageing report, which shows how long the quantity in hand has been with you, usually in buckets of 0–30, 31–60, 61–90 and over 90 days from the purchase date. Read it with the sales report beside it. An item with 400 units in the over-90 bucket and steady sales may simply be overbought; an item with no sales at all is dead.
What to do with each group
- Fast movers: keep calculated reorder levels and never let them fall below minimum. These pay the rent.
- Slow movers: cut the order quantity, not the safety stock. Buy smaller lots more often, even at a slightly worse rate.
- Dead stock: set the reorder level to zero so nobody buys it again by habit, then return it to the supplier if the terms allow, offer it to other traders, or clear it at cost. Money recovered at cost is better than money that never comes back.
- Seasonal items: for monsoon, summer, winter or festival items, take last year's daily sales for the same weeks, set the reorder level from that, and decide the date after which you stop reordering so you are not left holding the tail.
For medicines and food the ageing report must be read alongside expiry dates, since a batch can expire long before it looks old. Our guide to expiry stock control in pharmacies covers near-expiry lists and supplier returns in detail.
How often should you count stock?
Instead of one big annual count that closes the shop for two days, use cycle counting: count a small number of items every day so that A items are checked every month, B items every quarter and C items twice a year. Errors are found within weeks, while the cause is still traceable, and reorder levels stay reliable.
A distributor with 1,200 items might count about 20 items each working day. Give the counter the item names without the book quantity, so they count what is actually there. Compare with the system, and investigate any difference above a set tolerance, say 2% or ₹500, before adjusting. Common causes are a sale billed under the wrong item, free goods not entered, breakage not written off, and returns lying unentered in a corner.
The reason this belongs in a reorder article is simple. A reorder level is only as good as the stock figure it is compared with. If the system says 500 pouches and the rack has 300, the reorder will be triggered late, and the safety stock you calculated so carefully will quietly be used up.
What routine keeps reorder levels accurate?
Reorder levels go stale because sales rates, suppliers and lead times keep changing. A short daily, monthly and quarterly routine keeps them useful: review the below-reorder list every morning, recheck A items monthly, recalculate everything quarterly and before each season, and act on the ageing report every month.
- Every morning, print or view the list of items below reorder level and convert it into purchase orders before the supplier's cut-off time.
- Every morning, check items below minimum level separately and chase those orders by phone.
- Every day, count the scheduled cycle-count items and post corrections with a reason.
- Every month, review A items: has the average daily sale or the lead time moved by more than 15–20%? If yes, recalculate.
- Every month, read the stock ageing report and decide action on everything over 90 days.
- Every quarter, rerun ABC analysis and recalculate reorder, minimum and maximum levels for all items.
- Before each season, set seasonal reorder levels from last year's same-period sales and fix a stop date.
- Whenever a supplier changes, measure the new lead time for the first few orders rather than assuming the old one.
None of this needs expensive software, but doing it by hand for more than a few hundred items is tedious, which is why most traders keep these levels in their billing system. Tatva ERP (made by Kentron Technologies, the publisher of this site) is one example: it keeps a reorder list of items below their reorder level and turns it into purchase orders. Whatever you use, check that it lets you set the level per item and per godown, and that it shows the list without you having to remember to look. If you are still choosing a system, our guide to choosing billing and ERP software lists the questions to ask.
Start small. Pick your top 50 items by value this week, calculate the three levels for each from your own registers, and watch the shortages and the excess on just those items for two months. The numbers usually make the case for doing the rest.
Questions readers ask
What is the difference between reorder level and minimum stock level?
The reorder level is the point at which you place an order. The minimum level is lower: it is the reorder level minus normal lead-time demand, and stock falling below it means the order is late or sales have jumped. It is a warning line, not an ordering line.
Should I use 30 days or 90 days of sales to calculate average daily sales?
For steady items, 60 to 90 days smooths out odd weeks without going too far back. For items whose demand is clearly rising or falling, use a shorter period such as 30 days. For seasonal items, use last year's figures for the same weeks.
How much safety stock should a medical store keep?
There is no single figure. Calculate it per item with the maximum-minus-average method, or use days of cover, holding more for chronic and critical medicines that regular patients depend on and less for items that are easy to get by the next day. Keep expiry in mind so safety stock does not become expired stock.
When should an item be treated as dead stock?
Pick a fixed cut-off that suits your trade, commonly around 180 days without a sale, and apply it every month. Once an item is marked dead, set its reorder level to zero and decide whether to return, transfer or clear it.
Do I still need an annual stock count if I do cycle counting?
Many businesses still do a year-end count for their accounts and auditor, but with regular cycle counts it becomes a quick confirmation rather than a two-day exercise. Ask your accountant what your auditor expects.
Sources
Sanjeevani Prime is published by Kentron Technologies, which also makes Healthixio and Tatva ERP. Where an article mentions those products, we say so. This article is general information, not medical, legal or tax advice; rules change, so check the sources above before acting. Read our editorial policy.
Keep reading
GST
GSTR-1 vs GSTR-3B: what each return does and why they must match
GSTR-1 reports what you sold, GSTR-3B pays the tax on it, and since 2025 the portal has made it much harder for the two to disagree.
22 November 2026 · 9 min read
Cash flow
Credit control for distributors: limits, ageing, collections and cheque bounces
A distributor's profit is made on the invoice and lost in the outstanding. Here is a routine to keep the money coming in, with the legal basics you should know.
22 November 2026 · 9 min read
Buying guide
How to choose billing and ERP software for a small Indian business
A vendor-neutral method for shop owners, distributors and pharmacies to compare billing and ERP software before signing anything.
22 November 2026 · 8 min read